8  End-to-End Machine Learning Workflow

Setup Code (Click to Expand)
# packages needed to run the code in this section
# install.packages(c("tidyverse", "tidymodels", "remotes"))
# remotes::install_github("NHS-South-Central-and-West/scwplot")

# import packages
suppressPackageStartupMessages({
  library(dplyr)
  library(ggplot2)
  library(tidymodels)
})

# set plot theme
theme_set(scwplot::theme_scw(base_size = 16))

# import data
df <- readr::read_csv(here::here("data", "heart_disease.csv"))

# specify categorical features as factors
df <- df |> 
  mutate(
    sex = as.factor(sex),
    fasting_bs = as.factor(fasting_bs),
    resting_ecg = as.factor(resting_ecg),
    angina = as.factor(angina),
    heart_disease = as.factor(heart_disease)
  )

# set random seed to ensure reproducibility
set.seed(123)

An end-to-end machine learning workflow can be broken down into many steps, and there are an extensive number of layers of complexity that can be added, serving a variety of purposes. However, in this guide we will work through a bare bones workflow, using a simple dataset, in order to get a better understanding of the process.

A simple end-to-end ML solution will typically include the following steps:

  1. Importing & Cleaning Data
  2. Exploratory Data Analysis (See Chapter 5)
  3. Data Preprocessing
  4. Model Training
    • Selecting from Candidate Models
    • Hyperparameter Tuning
    • Identifying Best Model
  5. Fitting Model on Test Data
  6. Model Evaluation

For a more detailed discussion about a simple modeling workflow in R, Kuhn and Silge (2023)’s Model Workflow discussion in Tidy Modeling with R is a great resource.

8.1 Data

# inspect the data
glimpse(df)
Rows: 918
Columns: 10
$ age                <dbl> 40, 49, 37, 48, 54, 39, 45, 54, 37, 48, 37, 58, 39, 49, 42, 54, 38, 43, 60, 36, 43, 44, 49,…
$ sex                <fct> M, F, M, F, M, M, F, M, M, F, F, M, M, M, F, F, M, F, M, M, F, M, F, M, M, M, M, M, F, M, M…
$ resting_bp         <dbl> 140, 160, 130, 138, 150, 120, 130, 110, 140, 120, 130, 136, 120, 140, 115, 120, 110, 120, 1…
$ cholesterol        <dbl> 289, 180, 283, 214, 195, 339, 237, 208, 207, 284, 211, 164, 204, 234, 211, 273, 196, 201, 2…
$ fasting_bs         <fct> 0, 0, 0, 0, 0, 0, 0, 0, 0, 0, 0, 0, 0, 0, 0, 0, 0, 0, 0, 0, 0, 0, 0, 0, 0, 0, 0, 0, 0, 0, 0…
$ resting_ecg        <fct> Normal, Normal, ST, Normal, Normal, Normal, Normal, Normal, Normal, Normal, Normal, ST, Nor…
$ max_hr             <dbl> 172, 156, 98, 108, 122, 170, 170, 142, 130, 120, 142, 99, 145, 140, 137, 150, 166, 165, 125…
$ angina             <fct> N, N, N, Y, N, N, N, N, Y, N, N, Y, N, Y, N, N, N, N, N, N, N, N, N, Y, N, N, Y, N, N, N, N…
$ heart_peak_reading <dbl> 0.0, 1.0, 0.0, 1.5, 0.0, 0.0, 0.0, 0.0, 1.5, 0.0, 0.0, 2.0, 0.0, 1.0, 0.0, 1.5, 0.0, 0.0, 1…
$ heart_disease      <fct> 0, 1, 0, 1, 0, 0, 0, 0, 1, 0, 0, 1, 0, 1, 0, 0, 1, 0, 1, 1, 0, 0, 0, 1, 0, 0, 0, 0, 0, 0, 1…

8.1.1 Train/Test Split

One of the central tenets of machine learning is that the model should not be trained on the same data that it is evaluated on. This is because the model could learn spurious/random patterns and correlations in the training data, and this will harm the model’s ability to make good predictions on new, unseen data. There are many way of trying to resolve this, but the most simple approach is to split the data into a training and test set. The training set will be used to train the model, and the test set will be used to evaluate the model.

# split data into train/test sets
train_test_split <-
  rsample::initial_split(df,
                         strata = heart_disease,
                         prop = 0.7)

# extract training and test sets
train_df <- rsample::training(train_test_split)
test_df <- rsample::testing(train_test_split)

8.1.2 Cross-Validation

On top of the train/test split, we will also use cross-validation to train our models. Cross-validation is a method of training a model on a subset of the data, and then evaluating the model on the remaining data. This process is repeated multiple times, and the average performance is used to evaluate the model. This helps make the training process more generalisable.

For more information on cross-validation and how it can be used to train models Kuhn and Silge (2023)’s Resampling Methods discusses cross-validation in detail, in the wider context of resampling methods for training machine learning models. This helps to provide context for the purpose of cross-validation, as well as discussing some of the strategies for cross-validation.

We will use 5-fold stratified cross-validation to train our models. This means that the training data will be split into 5 folds, ensuring that each fold has the same proportion of the target classes. Each fold will be used as a test set once, and the remaining folds will be used as training sets. This will be repeated 5 times, and the average performance will be used to evaluate the model.

# create cross-validation folds
train_folds <- vfold_cv(train_df, v = 5, strata = heart_disease)

# inspect the folds
train_folds
#  5-fold cross-validation using stratification 
# A tibble: 5 × 2
  splits            id   
  <list>            <chr>
1 <split [513/129]> Fold1
2 <split [513/129]> Fold2
3 <split [514/128]> Fold3
4 <split [514/128]> Fold4
5 <split [514/128]> Fold5

8.1.3 Preprocessing

The purpose of preprocessing is to prepare the data for model fitting. This can take a number of different forms, but some of the most common preprocessing steps include:

  • Normalising/Standardising data
  • One-hot encoding categorical variables
  • Removing outliers
  • Imputing missing values

We will build two different preprocessing recipes and see which performs better. The first will be a ‘basic’ recipe that one-hot encodes all categorical features, and removes any features that have strong correlation with another feature in the dataset. The second recipe will include both these steps but will also normalise the numeric features so that they have a mean of zero and a standard deviation of one.

# specify simple preprocessing recipe
basic_recipe <- recipe(heart_disease ~ ., data = train_df) |>
  # one-hot encode categorical variables
  step_dummy(all_nominal_predictors(), one_hot = TRUE) |>
  # remove features that have strong correlation with another feature
  step_corr(all_numeric_predictors(), threshold = .5)

# specify scaled preprocessing recipe
scaled_recipe <- recipe(heart_disease ~ ., data = train_df) |>
  # normalise data so that it has mean zero and sd one
  step_normalize(all_numeric_predictors()) |> 
  # one-hot encode categorical variables
  step_dummy(all_nominal_predictors(), one_hot = TRUE) |>
  # remove features that have strong correlation with another feature
  step_corr(all_numeric_predictors(), threshold = .5)

# inspect basic preprocessing recipe
basic_recipe |>
  prep() |>
  bake(new_data = NULL)
# A tibble: 642 × 11
     age resting_bp cholesterol max_hr heart_peak_reading heart_disease sex_M fasting_bs_X1 resting_ecg_LVH
   <dbl>      <dbl>       <dbl>  <dbl>              <dbl> <fct>         <dbl>         <dbl>           <dbl>
 1    37        130         283     98                0   0                 1             0               0
 2    39        120         339    170                0   0                 1             0               0
 3    45        130         237    170                0   0                 0             0               0
 4    48        120         284    120                0   0                 0             0               0
 5    39        120         204    145                0   0                 1             0               0
 6    42        115         211    137                0   0                 0             0               0
 7    54        120         273    150                1.5 0                 0             0               0
 8    43        100         223    142                0   0                 0             0               0
 9    44        120         184    142                1   0                 1             0               0
10    40        130         215    138                0   0                 1             0               0
# ℹ 632 more rows
# ℹ 2 more variables: resting_ecg_ST <dbl>, angina_Y <dbl>
# inspect scaled preprocessing recipe
scaled_recipe |>
  prep() |>
  bake(new_data = NULL)
# A tibble: 642 × 11
       age resting_bp cholesterol  max_hr heart_peak_reading heart_disease sex_M fasting_bs_X1 resting_ecg_LVH
     <dbl>      <dbl>       <dbl>   <dbl>              <dbl> <fct>         <dbl>         <dbl>           <dbl>
 1 -1.74       -0.133      0.753  -1.52               -0.833 0                 1             0               0
 2 -1.53       -0.666      1.25    1.31               -0.833 0                 1             0               0
 3 -0.900      -0.133      0.341   1.31               -0.833 0                 0             0               0
 4 -0.585      -0.666      0.762  -0.656              -0.833 0                 0             0               0
 5 -1.53       -0.666      0.0457  0.328              -0.833 0                 1             0               0
 6 -1.21       -0.933      0.108   0.0134             -0.833 0                 0             0               0
 7  0.0436     -0.666      0.663   0.525               0.604 0                 0             0               0
 8 -1.11       -1.73       0.216   0.210              -0.833 0                 0             0               0
 9 -1.00       -0.666     -0.133   0.210               0.125 0                 1             0               0
10 -1.42       -0.133      0.144   0.0528             -0.833 0                 1             0               0
# ℹ 632 more rows
# ℹ 2 more variables: resting_ecg_ST <dbl>, angina_Y <dbl>

8.2 Model Training

There are many different types of models that can be used for classification problems, and selecting the right model for the problem at hand can be difficult when you are first starting out with machine learning.

Simple models like linear and logistic regressions are often a good place to start and can be used to get a better understanding of the data and the problem at hand, and can give you a good idea of baseline performance before building more complex models to improve performance. Another example of a simple model is K-Nearest Neighbours (KNN), which is a non-parametric model that can be used for both classification and regression problems.

We will fit a logistic regression and a KNN, as well as fitting a Random Forest model, which is a good example of a slightly more complex model that will often perform well on structured data.

8.2.1 Model Selection

# create a list of preprocessing recipes
preprocessers <-
  list(
    basic = basic_recipe,
    scaled = scaled_recipe
  )

# create a list of candidate models
models <- list(
  # logistic regression
  log = 
    logistic_reg(
      # tune regularisation parameters
      penalty = tune(),
      mixture = tune()
    ) |>
    set_engine('glmnet') |>
    set_mode('classification'),
  # k-nearest neighbours
  knn = 
    nearest_neighbor(
      # tune weighting function and number of neighbours
      weight_func = tune(),
      neighbors = tune()
      ) |>
    set_engine('kknn') |>
    set_mode('classification'),
  # random forest
  rf =
    rand_forest(
      # number of trees
      trees = 1000,
      # tune number of features to consider at each split
      # and minimum number of observations in a leaf
      mtry = tune(),
      min_n = tune()
      ) |>
    set_engine('ranger') |>
    set_mode('classification')
  )

# combine these lists as a workflow set
model_workflows <-
  workflow_set(
    preproc = preprocessers,
    models = models
  )

# specify the metrics on which the models will be evaluated
eval_metrics <- metric_set(f_meas, accuracy)

Having defined the preprocessing recipes and candidate models, we can now train and tune the models. We will use the tune_grid() function to carry out hyperparameter tuning1, which will search over a grid of hyperparameter values to find the best performing model. We will use 5-fold cross-validation to train the models, and will evaluate the models using F1 score and accuracy.

# train and tune models
trained_models <- 
  model_workflows |>
  workflow_map(
    # function to use for hyperparameter tuning
    fn = 'tune_grid',
    # cv folds for resampling
    resamples = train_folds,
    # grid of hyperparameter values to search over
    grid = 10,
    # metrics to evaluate model performance
    metrics = eval_metrics,
    verbose = TRUE,
    seed = 123,
    # control parameters for tuning
    control = control_grid(
      save_pred = TRUE,
      parallel_over = 'everything',
      save_workflow = TRUE)
    )

8.2.1.1 Comparing Model Performance

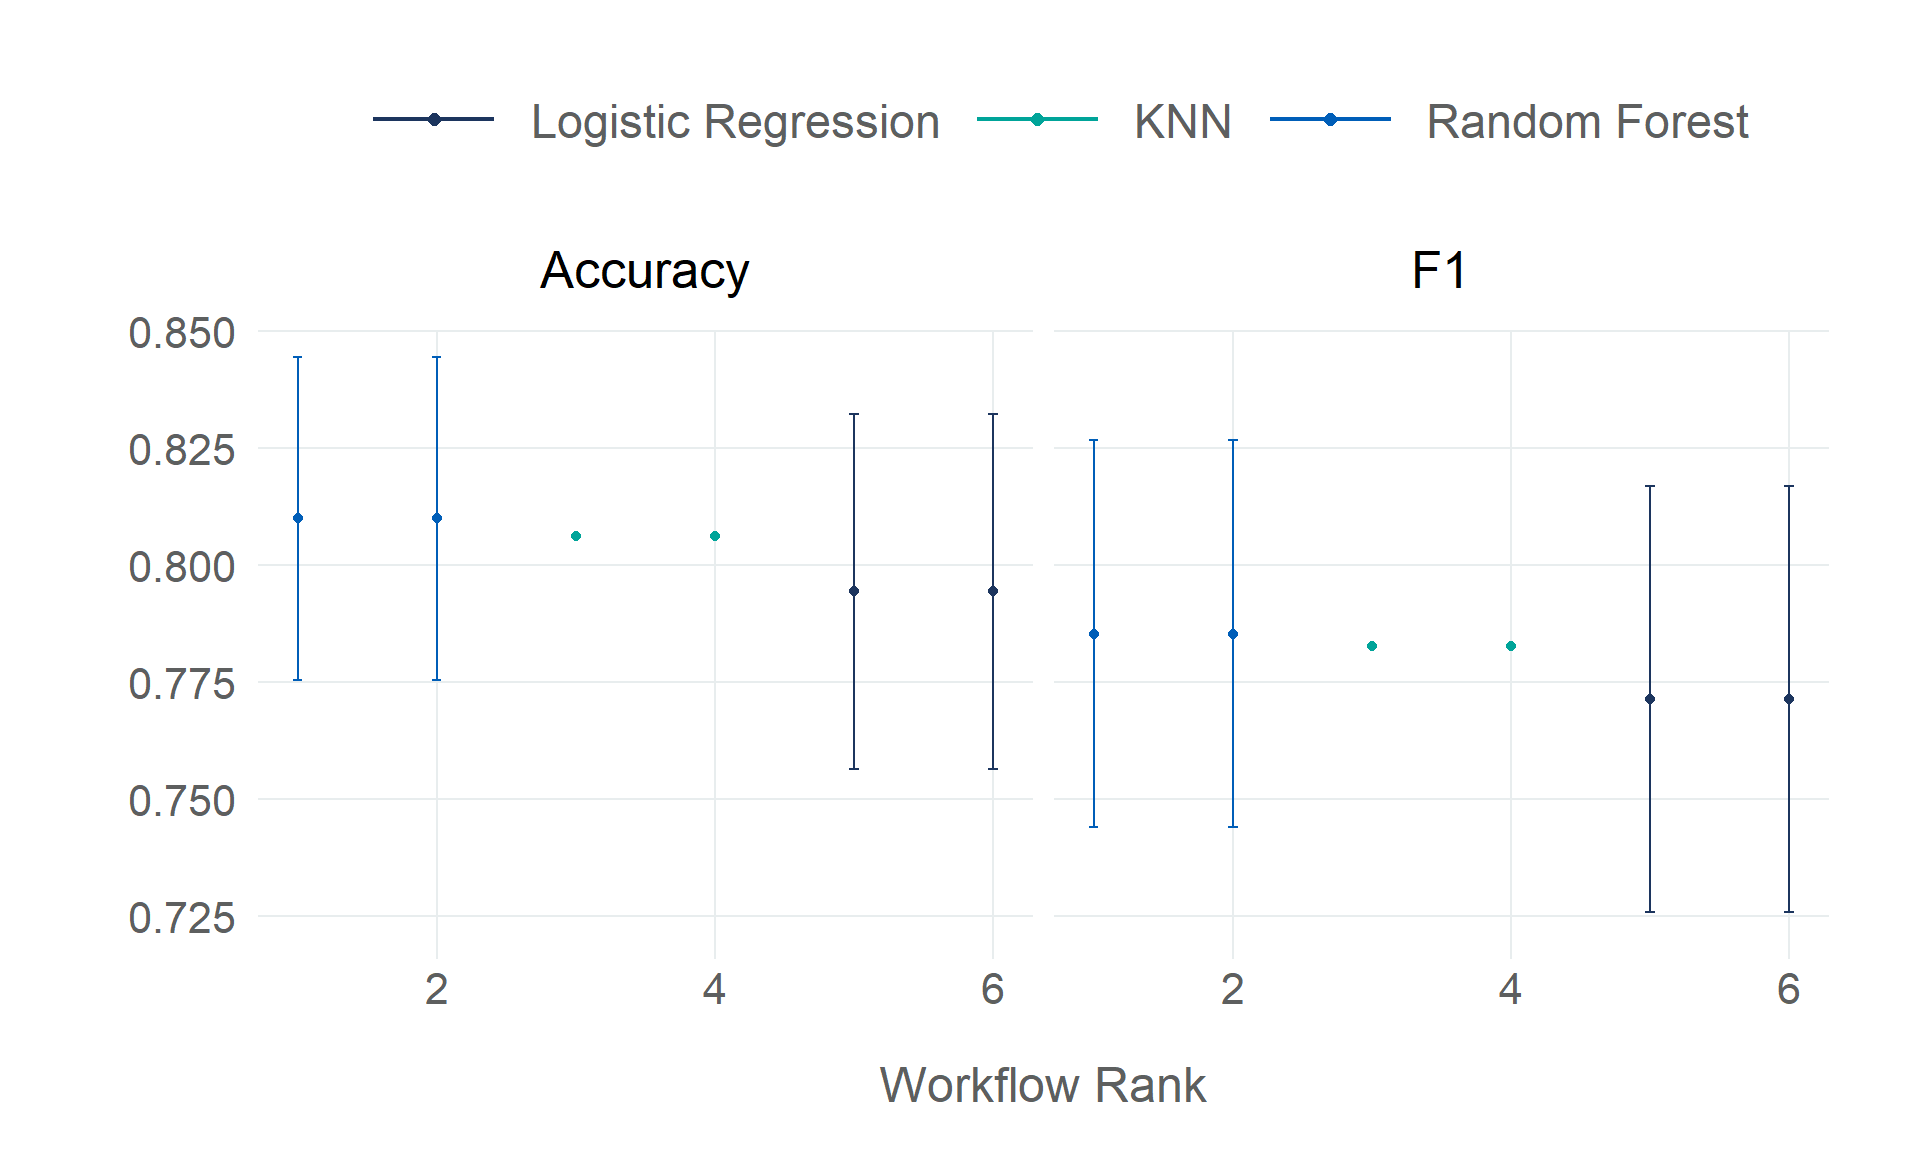
Once the models have been trained we can inspect the results to see which model performed best. We can also plot the performance of the models to get a better idea of how they performed.

# inspect the best performing models
trained_models |>
  rank_results(select_best=TRUE) |> 
  filter(.metric == 'f_meas') |> 
  select(wflow_id, model, f1 = mean)
# A tibble: 6 × 3
  wflow_id   model               f1
  <chr>      <chr>            <dbl>
1 basic_rf   rand_forest      0.785
2 scaled_rf  rand_forest      0.785
3 scaled_knn nearest_neighbor 0.783
4 basic_knn  nearest_neighbor 0.783
5 basic_log  logistic_reg     0.771
6 scaled_log logistic_reg     0.771
metric_labels = c("accuracy" = "Accuracy", "f_meas" = "F1")

# plot performance
trained_models |> 
  autoplot() +
  facet_wrap(~ .metric, labeller = as_labeller(metric_labels)) +
  scale_shape(guide = 'none') +
  scwplot::scale_colour_qualitative(
    labels = c("Logistic Regression", "KNN", "Random Forest"),
    palette = "scw"
    ) +
  guides(colour = guide_legend(override.aes = list(size=2, linewidth = .8)))

# select best models and plot performance
trained_models |> 
  autoplot(select_best = TRUE) +
  facet_wrap(~ .metric, labeller = as_labeller(metric_labels)) +
  labs(y = NULL) +
  scale_shape(guide = 'none') +
  scwplot::scale_colour_qualitative(
    labels = c("Logistic Regression", "KNN", "Random Forest"),
    palette = "scw"
    ) +
  guides(colour = guide_legend(override.aes = list(size=2, linewidth = .8)))
(a) All Models
(b) Best Models
Figure 8.1: Comparing accuracy and f1 score of Random Forest, KNN, and Logistic Regression models

8.3 Finalising Model

# save best performing model
best_results <-
   trained_models |>  
   extract_workflow_set_result('basic_rf') |>  
   select_best(metric = 'f_meas')

best_results
# A tibble: 1 × 3
   mtry min_n .config              
  <int> <int> <chr>                
1     2     7 Preprocessor1_Model10

8.4 Fitting Model on Test Data

Having selected the best performing model, we can now fit the model to the test data.

# fit model on test data
rf_test_results <-
   trained_models |>
   # extract the best performing model
   extract_workflow('basic_rf') |>
   finalize_workflow(best_results) |>
   # fit to test data and evaluate performance
   last_fit(split = train_test_split, metrics=eval_metrics)

8.5 Model Evaluation

Finally, we can inspect the performance of the model on the test data.

# inspect model performance on evaluation metrics
collect_metrics(rf_test_results)
# A tibble: 2 × 4
  .metric  .estimator .estimate .config             
  <chr>    <chr>          <dbl> <chr>               
1 f_meas   binary         0.836 Preprocessor1_Model1
2 accuracy binary         0.848 Preprocessor1_Model1
# inspect confusion matrix
rf_test_results |> 
  conf_mat_resampled(tidy=FALSE)
    0   1
0 107  26
1  16 127
# plot confusion matrix
rf_test_results |>
  conf_mat_resampled(tidy=FALSE) |> 
  autoplot(type='heatmap')
Figure 8.2: Confusion matrix visualising model performance, comparing predicted and actual values

8.6 Next Steps

In this post, we have covered a simple but robust machine learning workflow. We have have used the tidymodels package to fit a logistic regression model, a k-nearest neighbours model, and a random forest model to the heart disease dataset. We used cross-validation to make the results more generalisable, and we used hyperparameter tuning to improve model performance.

The next steps would be to consider what strategies for cross-validation would be most appropriate for the model we are building, what hyperparameter tuning process would produce the best performance, and some more complex algorithms that might outperform the models we’ve built here.

8.7 Resources

There are lots of great (and free) introductory resources for machine learning:

For a guided video course, Data Talks Club’s Machine Learning Zoomcamp (available on GitHub and YouTube) is well-paced and well-presented, covering a variety of machine learning methods and even covering some of the aspects that introductory course often skip over, like deployment and data engineering principles. However, while the ML Zoomcamp course is intended as an introduction to machine learning, it does assume a certain level of familiarity with programming (the course uses Python) and software engineering. The appendix section of the course is definitely helpful for bridging some of the gaps in the course, but it is still worth being aware of the way the course is structured.

If you are keen to learn more about machine learning but are particularly focused on (or already have experience in) R, the ML Zoomcamp may not be the best fit. If you want to learn about machine learning in R, Kuhn and Silge (2023) is a great place to start.

If you are looking for something that goes into greater detail about a wide range of machine learning methods, then there is no better resource than James et al. (2013)’s An Introduction to Statistical Learning, which is available in R and Python (and has an online course).

Finally, if you are particularly interested in learning the mathematics that underpins machine learning, I would highly recommend Mathematics of Machine Learning, which is admittedly not free but is very, very good. If you want to learn about the mathematics of machine learning but are not comfortable enough tackling the Mathematics of ML book, the StatQuest) and 3Blue1Brown YouTube channels are both really accessible and well-presented.


  1. For a more detailed discussion of hyperparameter tuning, and the different methods for tuning in tidymodels, Kuhn and Silge (2023)’s Model Tuning and the Dangers of Overfitting discussion is a good place to start. In addition, the AWS overview of Hyperparameter Tuning is a good resource if you are only looking for a brief overview. Finally, for an in-depth discussion about how hyperparameter tuning works, including the mathematics behind it, Jordan (2017) is thorough but easy to follow.↩︎